Are you struggling to quickly identify which items are contributing to the costs of your products and impacting profitability?
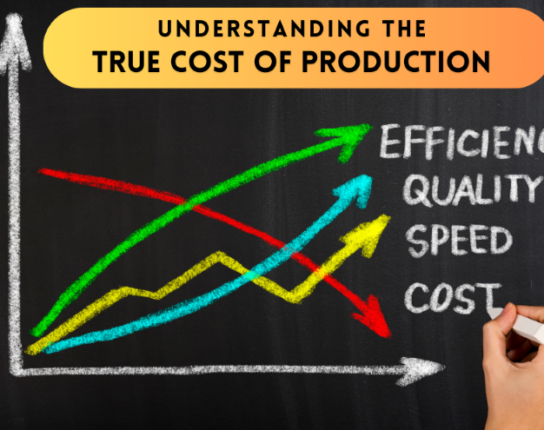
Our team of experts leverages Microsoft technologies to give you a comprehensive view of your product costs and profitability. In Part 2 of this video demo, we dive into Microsoft Dynamics 365 Business Central and show you how to run a cost distribution graphical report to see which items are driving your product costs.
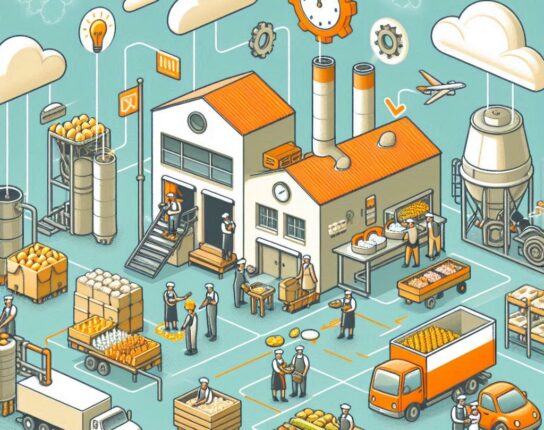
With Harvest Food Solutions, you can drill down deeper into the data and see purchase cost history, vendor details, and the raw material impact on the profitability of an item. With this knowledge, you can make informed decisions about which items to keep, retire or improve.
Profitability is the key to success in any business. That’s why Harvest Food Solutions provides you with the tools and expertise you need to maximize your profits and grow your business.
Don’t let poor item profitability hold you back. Click on the video above to view the demo or contact Harvest Food Solutions today to learn more about how we can help you take your business to the next level.


Recent posts
-

-

-
 December 18, 2024
Navigating FSMA Rule 204: Key Insights for Food Manufacturers